- 如有疑问,请联系电邮
- contact@eetcgroup.com
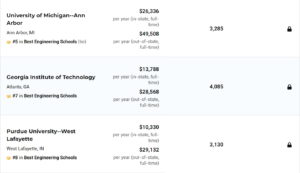
USNEWS:2020年全美最佳工程学院

USNEWS:在空档年学生应该如何为上大学做准备
2019年3月17日
USNEWS:2020年全美最佳医学院(研究型)
2019年3月18日
By Robert Morse, Kenneth Hines, and Elizabeth Martin
美国新闻研究生工程项目排名调查了214所授予博士学位的工程学校。
不出意外,传统的工科三强,再加两综合院校继续霸占前五,分别是麻省第一,斯坦福第二,伯克利第三,卡内基梅陇与加州理工分列四五。工程学院是一个国家科技实力的直接体现,在学校排名中所占的比重排第一位,所以是非常非常重要!如果对理工科感兴趣,在学校选择时,一定要专注工程学院的排名,而不是选择综合排名。
统计数据收集于2018年秋季和2019年初。提供必要数据的199所学校的排名是根据以下10个指标的加权平均值计算的。
质量评定(权重0.40)
•同行评估分数(0.25):与往年一样,2018年秋季,工程学院的工程学院院长和工程学院研究生研究院院长被要求对课程从边缘(1)到优秀(5)进行评分。那些对一所学校不太了解而无法公正评价的人被要求在“不知道”上打上标记。在2018年接受调查的人中,62%的人回答说。
一所学校的得分是2018年秋季调查中对其进行评分的所有受访者的平均评分。“不知道”的回答既不支持学校,也不反对学校。
•招聘者评估得分(0.15):与前几年一样,在2018年秋季,公司招聘者、雇主和公司联系人从所有工程项目中聘用并提供美国新闻受访者姓名,他们被要求对项目进行从边缘(1)到突出(5)的评分。那些对学校不太了解而无法公平评估的人被要求标注“不知道”。工程学校向《美国新闻》提供了2018年夏季被调查人员评估分数的名单。
学校的得分是在最近三年的调查结果中对所有被调查者的平均评分。“不知道”的回答既不支持学校,也不反对学校。
《美国新闻》收集了所有同行和招聘人员的评估数据。
学生选择性(权重0.10)
•GRE量化平均分(0.0675):这是2018年秋季硕士和博士生入学GRE的量化平均分。
这些GRE数据只能通过美国新闻工程学院指南针订阅获得。
学校报告说,只有不到50%的入学学生提交GRE分数,其加权百分位数分布按提交考试分数的学生身体百分比相对于50%阈值的比例向下调整。例如,如果进入课堂的25%提交了GRE测试分数,那么排名模型中的测试分数值将减少50%。
•录取率(0.0325):这是2018年秋季入学的学校硕士和博士项目的申请者比例。
教员资源(权重0.25)
•师生比:这是2018年秋季全日制博士生与全日制终身制或终身制教师(0.075)以及全日制硕士生与全日制终身制或终身制教师(0.0375)的比率。
•国家工程学院教师比例(0.075):这是2018年秋季成为国家工程学院成员的全职终身制或终身制轨道教师比例。
•授予博士学位(0.0625):这是2017-2018学年授予博士学位的总数。
研究活动(权重0.25)
•研究总支出(0.15):这是外部资助的工程研究总支出。这些支出是指学校在2017和2018财政年度进行并平均进行的独立资助的公共和私人研究。美国新闻的统计调查使用美国工程教育学会(ASEE)对研究支出的定义。在许多情况下,美国新闻交叉调查报告了研究支出数据,同时向亚欧会议提交了工程学院的研究支出数据。
•每位教职员工的平均研究支出(0.10):这是每位全职教职员工在2017和2018财年的平均外部资助工程研究支出。
总体排名
对数据的平均值进行标准化,并对标准化分数进行加权、汇总和重新调整,使得分最高的学校获得100分;其他学校的分数按得分最高的百分比计算。研究生工程学校根据分数按降序排列。
在主要的工程排名中,《美国新闻》在数量上排名前四分之三的有资格获得排名的工程学校。排名靠后的四分之一符合条件的工程学校按字母顺序列为未公布的排名。
如果一所学校被列为无排名学校,这意味着《美国新闻报》没有计算出它的数字排名,因为该学校没有提供足够的关键统计数据来进行数字排名。标记为“未评分”的学校按字母顺序列在标记为“未公布排名”的学校下方。下图是前十排名。


FOR THE U.S. NEWS rankings of graduate engineering programs, 214 engineering schools that grant doctoral degrees were surveyed.
Statistical data were collected in fall 2018 and early 2019. Rankings for the 199 schools that provided the necessary data were calculated based on a weighted average of the 10 indicators described below.
Quality Assessment (weighted by 0.40)
• Peer assessment score (0.25): In fall 2018, as in previous years, engineering school deans and deans of graduate studies at engineering schools were asked to rate programs on a scale from marginal (1) to outstanding (5). Those individuals who did not know enough about a school to evaluate it fairly were asked to mark “don’t know.” Sixty-two percent of those surveyed in 2018 responded.
A school’s score is the average rating of all the respondents who rated it in the fall 2018 surveys. Responses of “don’t know” counted neither for nor against a school.
• Recruiter assessment score (0.15): In fall 2018, as in previous years, corporate recruiters, employers and company contacts who hired from all the engineering programs and provided U.S. News respondent names were asked to rate programs on a scale from marginal (1) to outstanding (5). Those individuals who did not know enough about a school to evaluate it fairly were asked to mark “don’t know.” The engineering schools provided the names of those surveyed for the recruiter assessment score in summer 2018 to U.S. News.
A school’s score is the average rating of all the respondents who rated it in the three most recent years of survey results. Responses of “don’t know” counted neither for nor against a school.
U.S. News collected all the peer and recruiter assessment data.
Student Selectivity (weighted by 0.10)
• Mean GRE quantitative score (0.0675): This is the mean quantitative score on the GRE for master’s and doctoral students entering in fall 2018.
These GRE data are only available via a U.S. News Engineering School Compass subscription.
Schools reporting that less than 50 percent of their entering students submitted GRE scores had their weighted percentile distributions adjusted downward by the proportion of the percentage of the student body that submitted test scores in relation to the 50 percent threshold. For example, if 25 percent of the entering class submitted GRE test scores, then the test scores were reduced in value in the ranking model by 50 percent.
• Acceptance rate (0.0325): This is the proportion of applicants to a school’s master’s and doctoral programs who were offered admission for fall 2018.
Faculty Resources (weighted by 0.25)
• Student-faculty ratios: This is the ratio of full-time doctoral students to full-time tenured or tenure-track faculty (0.075) and full-time master’s students to full-time tenured or tenure-track faculty (0.0375) in fall 2018.
• Percentage of faculty in the National Academy of Engineering (0.075): This is the proportion of full-time tenured or tenure-track faculty who were members of the National Academy of Engineering in fall 2018.
• Doctoral degrees awarded (0.0625): This is the total number of doctoral degrees granted in the 2017-2018 school year.
Research Activity (weighted by 0.25)
• Total research expenditures (0.15): This is the total of externally funded engineering research expenditures. These expenditures refer to separately funded research, public and private, that the school conducted and are averaged over fiscal years 2017 and 2018. U.S. News’ statistical surveys use the American Society for Engineering Education’s, or ASEE, definition of research expenditures. In many of cases, U.S. News cross-checks reported research expenditure data with research expenditure data engineering schools submitted to the ASEE for the same time period.
• Average research expenditures per faculty member (0.10): This is the average amount of externally funded engineering research expenditures per full-time faculty member, averaged over fiscal years 2017 and 2018.
Overall Rank
Data were standardized about their means, and standardized scores were weighted, totaled and rescaled so that the top-scoring school received 100; scores for the others were calculated as a percentage of the top score. Graduate engineering schools were then numerically ranked in descending order, based on their scores.
In the main engineering rankings, U.S. News numerically ranked the top three-quarters of the engineering schools that qualified to be ranked. The bottom quarter of the rank-eligible engineering schools are listed alphabetically as Rank Not Published.
If a school is listed as Unranked, that means that U.S. News did not calculate a numerical rank for it because the school did not supply enough key statistical data to be numerically ranked. Schools marked as Unranked are listed alphabetically below those marked as Rank Not Published.
Specialty Rankings
Engineering specialty rankings, such as chemical engineering and civil engineering, are based solely on peer assessments by department heads in each specialty area. U.S. News conducted peer assessment surveys in fall 2018 for the specialty rankings.
Specialty department heads rated the other schools that offered a doctoral degree in their specialty on a 5-point scale. Schools with the highest average scores appear in the rankings.
In summer 2018, engineering schools provided U.S. News with the names of schools granting doctoral degrees in each specialty, as well as the names of department heads surveyed.
The number of schools rated in each doctoral department specialty ranking and the response rate among those schools surveyed in fall 2018 were as follows:
- 66 schools for aerospace / aeronautical / astronautical engineering (response rate: 68 percent)
- 131 schools for bioengineering / biomedical engineering (63 percent)
- 33 schools for biological and agricultural engineering (64 percent)
- 127 schools for chemical engineering (68 percent)
- 152 schools for civil engineering (61 percent)
- 148 schools for computer engineering (51 percent)
- 186 schools for electrical / electronic / communications engineering (53 percent)
- 99 schools for environmental / environmental health engineering (61 percent)
- 91 schools for industrial / manufacturing / systems engineering (57 percent)
- 111 schools for materials engineering (60 percent)
- 181 schools for mechanical engineering (53 percent)
- 28 schools for nuclear engineering (86 percent)
- 18 schools for petroleum engineering (94 percent)
In the engineering specialty rankings, programs with an average peer assessment score of equal to or greater than 2.0 are numerically ranked. Schools with scores below 2.0 in a specialty are listed alphabetically as Rank Not Published. For these schools, U.S. News calculated a numerical rank but decided for editorial reasons not to publish it. In the engineering specialty rankings, if an engineering program received fewer than five votes, it is listed as Unranked.
U.S. News will supply programs in the engineering specialties that have an average peer assessment score of less than 2.0 with their numerical ranks if they submit a request following the procedures listed in the Information for School Officials.


